Related Topics
Review Device Health
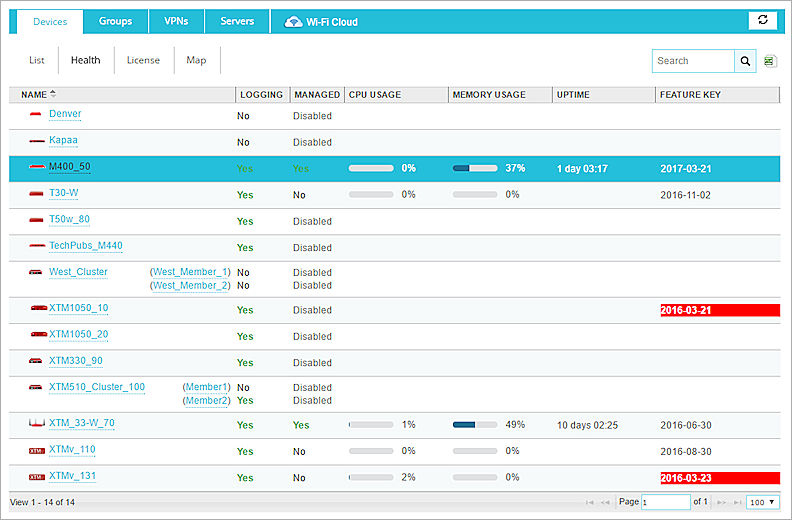
From the Dimension Devices > Health page, you can see the most recent health statistics for all of your managed Fireboxes and FireClusters. Health statistics are not available for Fireboxes that are only configured for logging to Dimension.
Each managed Firebox sends health statistics to Dimension every 15 minutes. The most recent information appears in the Health View section.
The Health list includes this information for each Firebox:
- Logging — Current status of the logging connection for the Firebox
- Managed — Current status of the management connection for the Firebox
- CPU usage — The percentage of the Firebox CPU in use
- Memory usage — The percentage of memory on the Firebox in use
- Uptime — The amount of time since the last Firebox reboot
- Feature key — The next date that a licensed feature on your Firebox will expire
You can sort the Health list by any column.
To see the Health list:
- Log in to Dimension.
The Devices page appears. - Select the Health tab.
The Health list appears.

Example of the Health list with both managed Fireboxes and Fireboxes with only a logging connection.