
Related Topics
TDR Dashboard
The Dashboard page appears by default in the Threat Detection and Response web UI, when you log in as a user with Operator, Analyst, or Observer credentials. The Dashboard includes several counters and metrics, and is a snapshot of activity for your account. The date and time the data was last refreshed appears at the top-right of the page. To update the data, click Refresh Now.
Dashboard Widgets
The top of the Dashboard has three widgets that summarize the current indicators, remediations, and Host Sensor status.
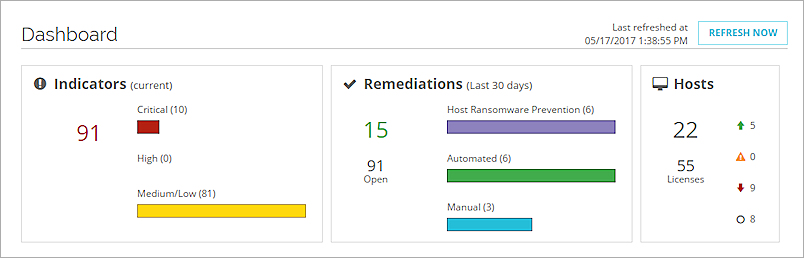
The Threat Detection and Response Dashboard provides a summary of the current indicators and Host Sensors on your network.
Indicators
The Indicators widget shows statistics for indicators in three categories, based on the score:
- Critical — Scores of 8, 9, or 10
- High — Scores of 6 or 7
- Medium/Low — Scores of 3, 4, or 5
You can complete these actions to see details about the indicators:
- To open the Indicators page with filters set for a specific threat level, click the number for that threat level.
- To see a filtered list of indicators for a threat category, click the number or bar of the category.
- To see a list of all indicators with a threat score of 3 or higher, click the total number at the left of the panel.
For more information about threat scores, see About TDR Threat Scores.
Remediations
The Remediations widget shows statistics for Host Ransomware Prevention, Automated, Manual, and Open remediations. The total number is the sum of Host Ransomware Prevention, Automated and Manual remediations. A Host Ransomware Prevention remediation is an action taken by a Host Sensor configured in Prevent mode to remove ransomware from the host. An Automated remediation is a successful action completed by the system, based on a policy. A Manual remediation is a requested action successfully performed by an Operator.
You can complete these actions to see details about remediation status of indicators:
- To open the Indicators page with filters applied to show indicators for a specific remediation status, click the Host Ransomware Prevention, Automated or Manual number.
- To see details about all remediated indicators, click the Total number.
- To see details about all unremediated indicators, click the Open number .
Hosts
The Hosts widget shows statistics about hosts and Host Sensors in your account. The top-left number indicates the number of hosts that have a Host Sensor installed. The bottom-left number indicates the number of Host Sensor licenses for your account. On the right, the numbers show the number of installed Host Sensors in each of four states.
-
 — Host Sensor is installed and operational
 -
 — Host Sensor is installed but has a problem
 -
 — Host Sensor is not communicating
 -
 — Host Sensor has shut down correctly
Indicator Timeline
The Indicator Timeline appears in the middle section of the Dashboard page. The Indicator Timeline shows a history of unresolved or resolved indicators. Use the radio buttons at the top to select the type of information to show.
- To see the resolved indicator timeline, select Resolved.
- To see the unresolved indicator timeline, select Unresolved.
By default, the Indicator Timeline shows the history of unresolved indicators with scores higher than 2.
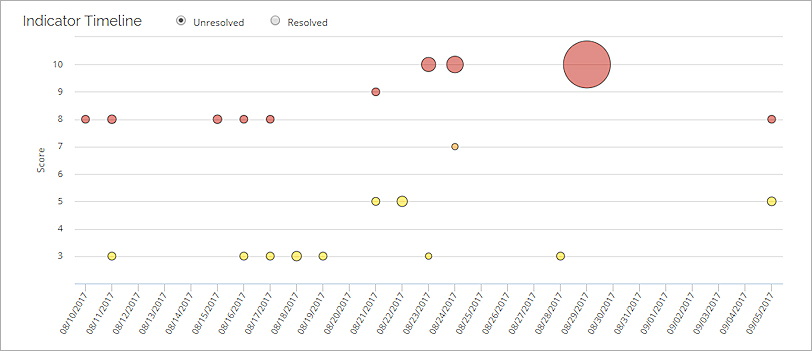
In the Indicator Timeline:
- The left scale is the indicator threat score.
- The size of each bubble reflects the number of Indicators with a specific score for that day.
- The color of each bubble corresponds to the color of the scores in the Incidents and Indicator pages.
To see more detail in the timeline, you can zoom in on a section of the timeline and click or hover on a bubble.
- To zoom in on a section of the timeline, click and drag over the area of the chart to select.
The chart resizes to show the selected area. - To zoom out to the full timeline view, click Reset Zoom.
To see more detail about a bubble:
- Place your cursor over the bubble.
The bubble changes to blue. A tooltip shows the Date, Score, and Count. The Count is the number of indicators with the score shown.
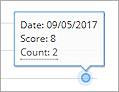
For resolved indicators, the Score is the previous score before the indicators were remediated.
- To see the list of indicators associated with a bubble, click the bubble.
Or, in the tooltip, click Count.
For unresolved indicators, the Indicator page appears, filtered for the Score and Date of the selected bubble. For resolved indicators, the Remediations page appears, filtered for the Previous Score and Date of the selected bubble.
Top Indicators by Host
The Top Indicators by Host section appears at the bottom of the Dashboard page. This is a list of the top ten hosts, ranked by the number of indicators that have not been remediated.
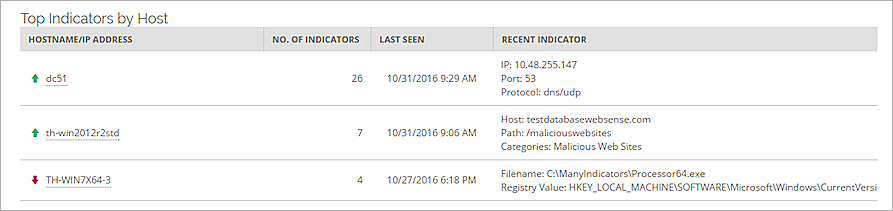
To open the Indicators page with filters applied to show the indicators for a specific host, click the host name.