Applies To: WatchGuard Advanced EPDR, WatchGuard EPDR, WatchGuard EDR
Endpoint Access Enforcement monitors connections to computers on your network to reduce infections from unprotected devices (Windows, Mac, and Linux). The Endpoint Access Enforcement dashboard shows information about connections between computers on the network that meet conditions you configure in the Endpoint Access Enforcement settings. For more information, go to Configure Endpoint Access Enforcement Settings (Windows Computers).
With WatchGuard Advanced EPDR, EPDR, and EDR, you can use the information from the dashboard to take action on identified at-risk devices.
With Advanced EPDR, you can also block inbound connections from computers at risk.
Several tiles provide important information and links to more details.
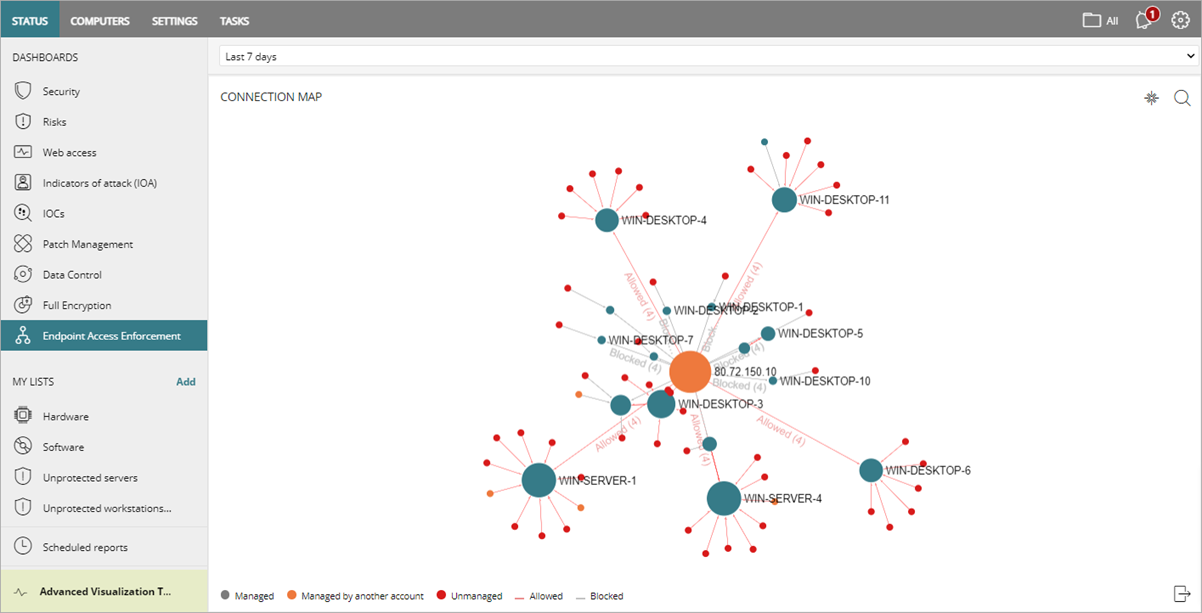
To open the Endpoint Access Enforcement dashboard:
- In WatchGuard Cloud, select Monitor > Endpoints.
- Select Status > Endpoint Access Enforcement.
The Endpoint Access Enforcement dashboard opens. - To view detailed information, click a tile. The Endpoint Access Enforcement dashboard includes these tiles:
Time Period Selector
The dashboard shows information for the time period you select from the drop-down list at the top of the Status page.

You can select these time periods:
- Last 24 hours
- Last 7 days
- Last month
Connection Map
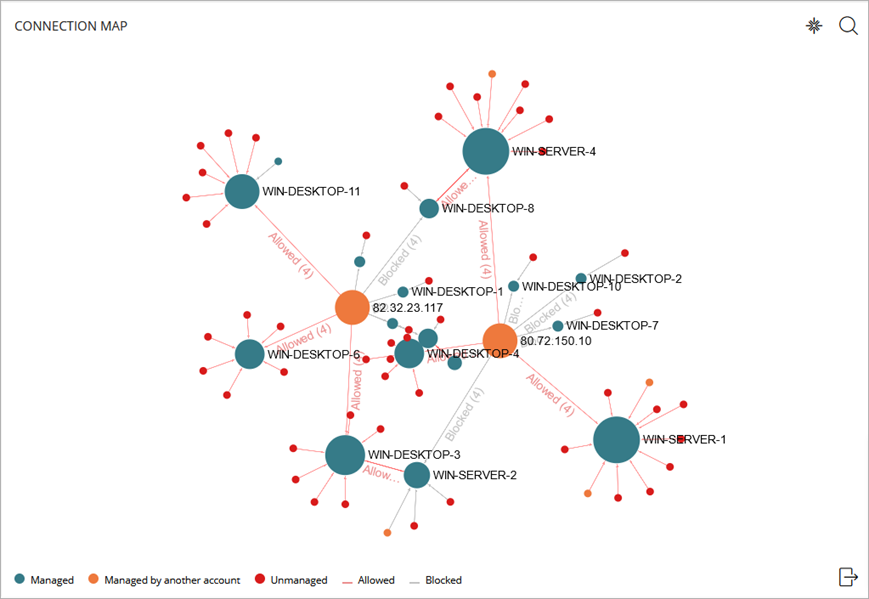
The Connection Map tile shows the connections between computers on the network that meet the conditions you configure in the Endpoint Access Enforcement settings.
Nodes
Each node (solid circle) on the map represents a computer on the network that meets the conditions configured in the Endpoint Access Enforcement settings that identify a computer at risk
The size of the node represents the number of inbound and outbound connections to and from the computer. The larger the number of connections with computers at risk, the larger the node. The color of the node indicates the management status of the computer.
Blue
Represents a computer that is managed by Endpoint Security and by the same account as the connecting computer.
Orange
Represents computer that is managed by Endpoint Security but by a different account than the connecting computer.
Red
Represents a computer that is unmanaged by Endpoint Security.
Connection Lines
Connection lines represent connections between computers. The color of the line indicates the connection status of the computer.
Red
Shows allowed connections between two computers for the selected time period.
Gray
(Advanced EPDR) Shows blocked inbound connections between two computers for the selected time period.
To view the outbound or inbound connections for a computer, point to a node.
An information panel shows a list of any at-risk inbound and outbound connections to the computer and the number of blocked and allowed inbound connections from each connected computer.
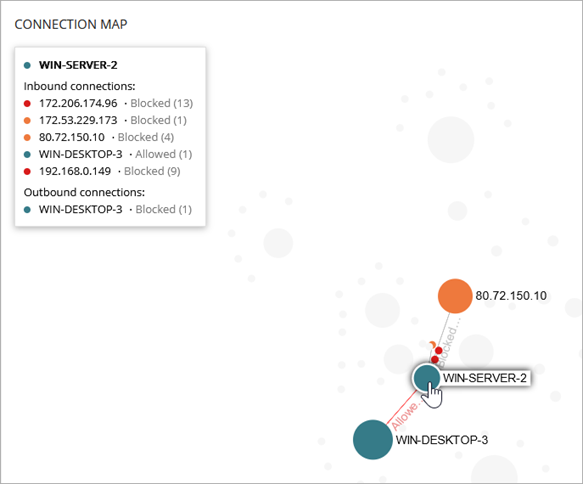
In this image, the information panel shows a list of the inbound connections to WIN-SERVER-2. Based on the configured Endpoint Access Enforcement settings, connections are blocked from multiple IP addresses. An inbound connection from WIN-DESKTOP-3 is allowed.
In the Outbound Connections list, the blocked connection from WIN-DESKTOP-3 represents a blocked inbound connection based on the Endpoint Access Enforcement settings assigned to WIN-SERVER-2.
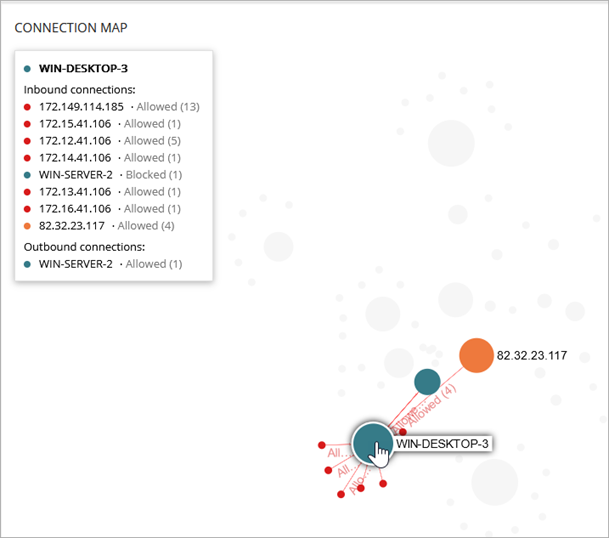
In this second image, the information panel shows a blocked inbound connection to WIN-DESKTOP-3 from WIN-SERVER-2.
To find a computer on the map, click ![]() . In the search text box, type the computer name or IP address, then select the computer from the list.
. In the search text box, type the computer name or IP address, then select the computer from the list.
To zoom in and out on the map, use the mouse wheel. To reset the map, in the upper-right corner, click ![]() .
.
Click a node to open the Connections Identified by Endpoint Access Enforcement list filtered for that computer.
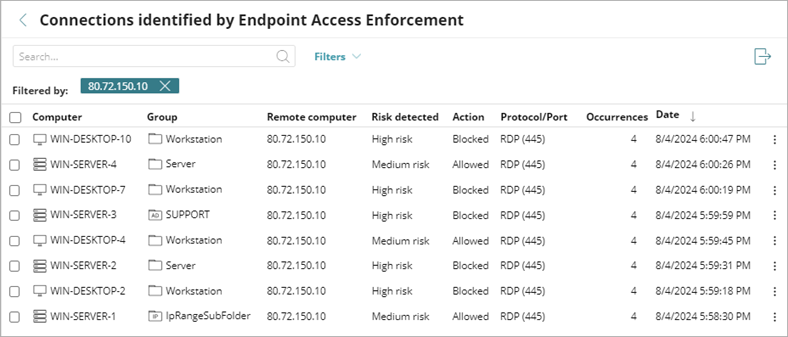
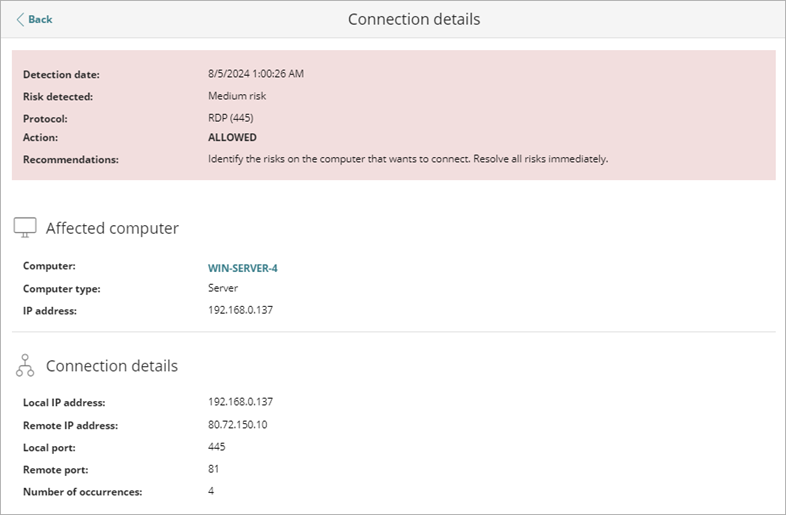
To view the connection details for a computer, click a computer in the list.
Top 5 Computers Reporting High-Risk Outbound Connections
The Top 5 Computers Reporting High-Risk Outbound Connections tile shows five computers that have the highest number of high-risk connections to computers on the network.
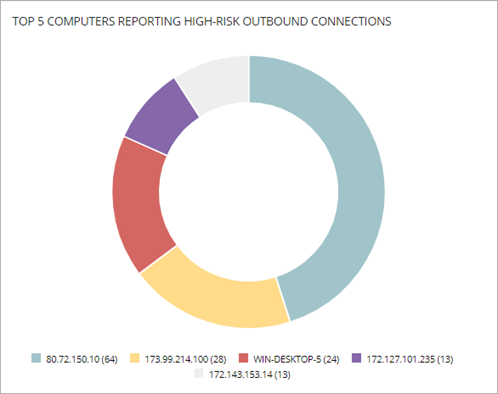
If the computer is managed by the same account that manages the target computer and you have access to the computer, the computer name shows. If not, the IP address shows.
Click an area of the circle to open the Connections Identified by Endpoint Access Enforcement list filtered for that computer.
Top 5 Computers Reporting High-Risk Inbound Connections
The Top 5 Computers Reporting High-Risk Inbound Connections tile shows five computers that received the highest number of high-risk inbound connections from managed computers.
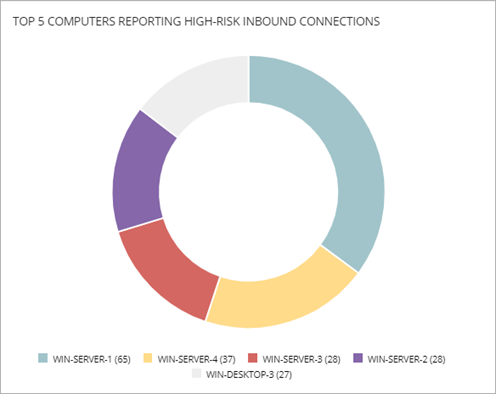
Click an area of the circle to open the Connections Identified by Endpoint Access Enforcement list filtered for that computer.
Connections by Condition
The Connections by Condition tile shows high-risk connections by the risk detected over a period of time.
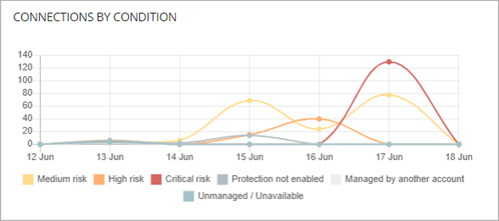
The detected risks are:
- Unmanaged — Number of connections identified where the connecting computer does not have Advanced EPDR, EPDR, or EDR installed or is unavailable. Make sure the protection meets the minimum requirements. For more information, go to Configure Endpoint Access Enforcement Settings (Windows Computers).
- Managed by Another Account — Number of connections identified where the connecting computer has Advanced EPDR, EPDR, or EDR installed but is managed by another account.
- Protection Not Enabled — Number of connections identified where the connecting computer has Advanced EPDR, EPDR, or EDR installed but the protection software is disabled.
- Critical Risk — Number of connections identified where the risk level of the connecting computer is critical.
- High Risk — Number of connections identified where the risk level of the connecting computer is high.
- Medium Risk — Number of connections identified where the risk level of the connecting computer is medium.
Click an area of the graph to open the Connections Identified by Endpoint Access Enforcement list filtered by the selected condition.
Connections by Monitored Protocol
The Connections by Monitored Protocol tile shows the connections made over monitored protocols for a period of time. The tile shows each protocol selected in the Endpoint Access Enforcement settings.
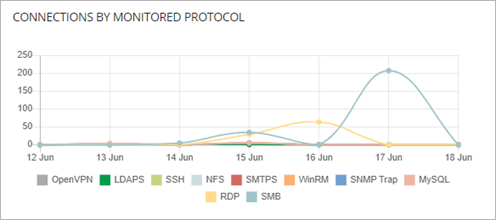
Click an area of the graph to open the Connections Identified by Endpoint Access Enforcement list filtered by the selected protocol.
Configure Endpoint Access Enforcement Settings (Windows Computers)