In Fireware v12.3 or higher, you can view FireCluster diagnostic information in a centralized location. This information can help you monitor and troubleshoot your FireCluster.
The FireCluster diagnostics page is available only in Fireware Web UI.
View the FireCluster Diagnostics Page
- Connect to the cluster master. Tip!
- Select System Status > FireCluster.
The FireCluster page appears.

The FireCluster diagnostics page includes these sections:
General Information
On the upper section of the page, you can see information about the cluster and cluster members. By default, this information refreshes every 30 seconds. To configure a different refresh interval, select one of these options from the Refresh Interval drop-down list:
- 5 seconds
- 10 seconds
- 30 seconds
- 60 seconds
- 2 minutes
- 5 minutes
To pause automatic page refreshes, click the Pause button  . After you leave the FireCluster diagnostics page, the refresh interval resets to 30 seconds.
On this page, you can view this cluster information:
- Synchronization status — Synchronized means the cluster has two members: one member with the cluster master role, and another member with the backup master role.
- Cluster enabled for — The elapsed time since you first enabled the cluster.
- Cluster mode — The type of cluster configuration: active/passive or active/active.
- Cluster ID — A numerical value that identifies the cluster. The Cluster ID is used to calculate the virtual MAC (VMAC) address. For network segments with multiple active clusters, Cluster IDs are used to identify each cluster.
- Connections — The number of Firebox connections.
- Connections per second — Connection rate.
You can also view this information for cluster members:
- Member role — Master or Backup.
- Serial number — Firebox serial number.
- Status — Online or Offline.
- Uptime — How long the member has been online since it was last offline. If a member is offline, the uptime value is 0s.
- CPU — Percentage of CPU resources in use.
- Memory — Percentage of memory in use.
To quickly determine whether cluster operations are normal, look for these color-coded icons on tabs and sections:
 — A green check mark indicates normal operation.
 — A red "x" indicates an issue that requires your attention.
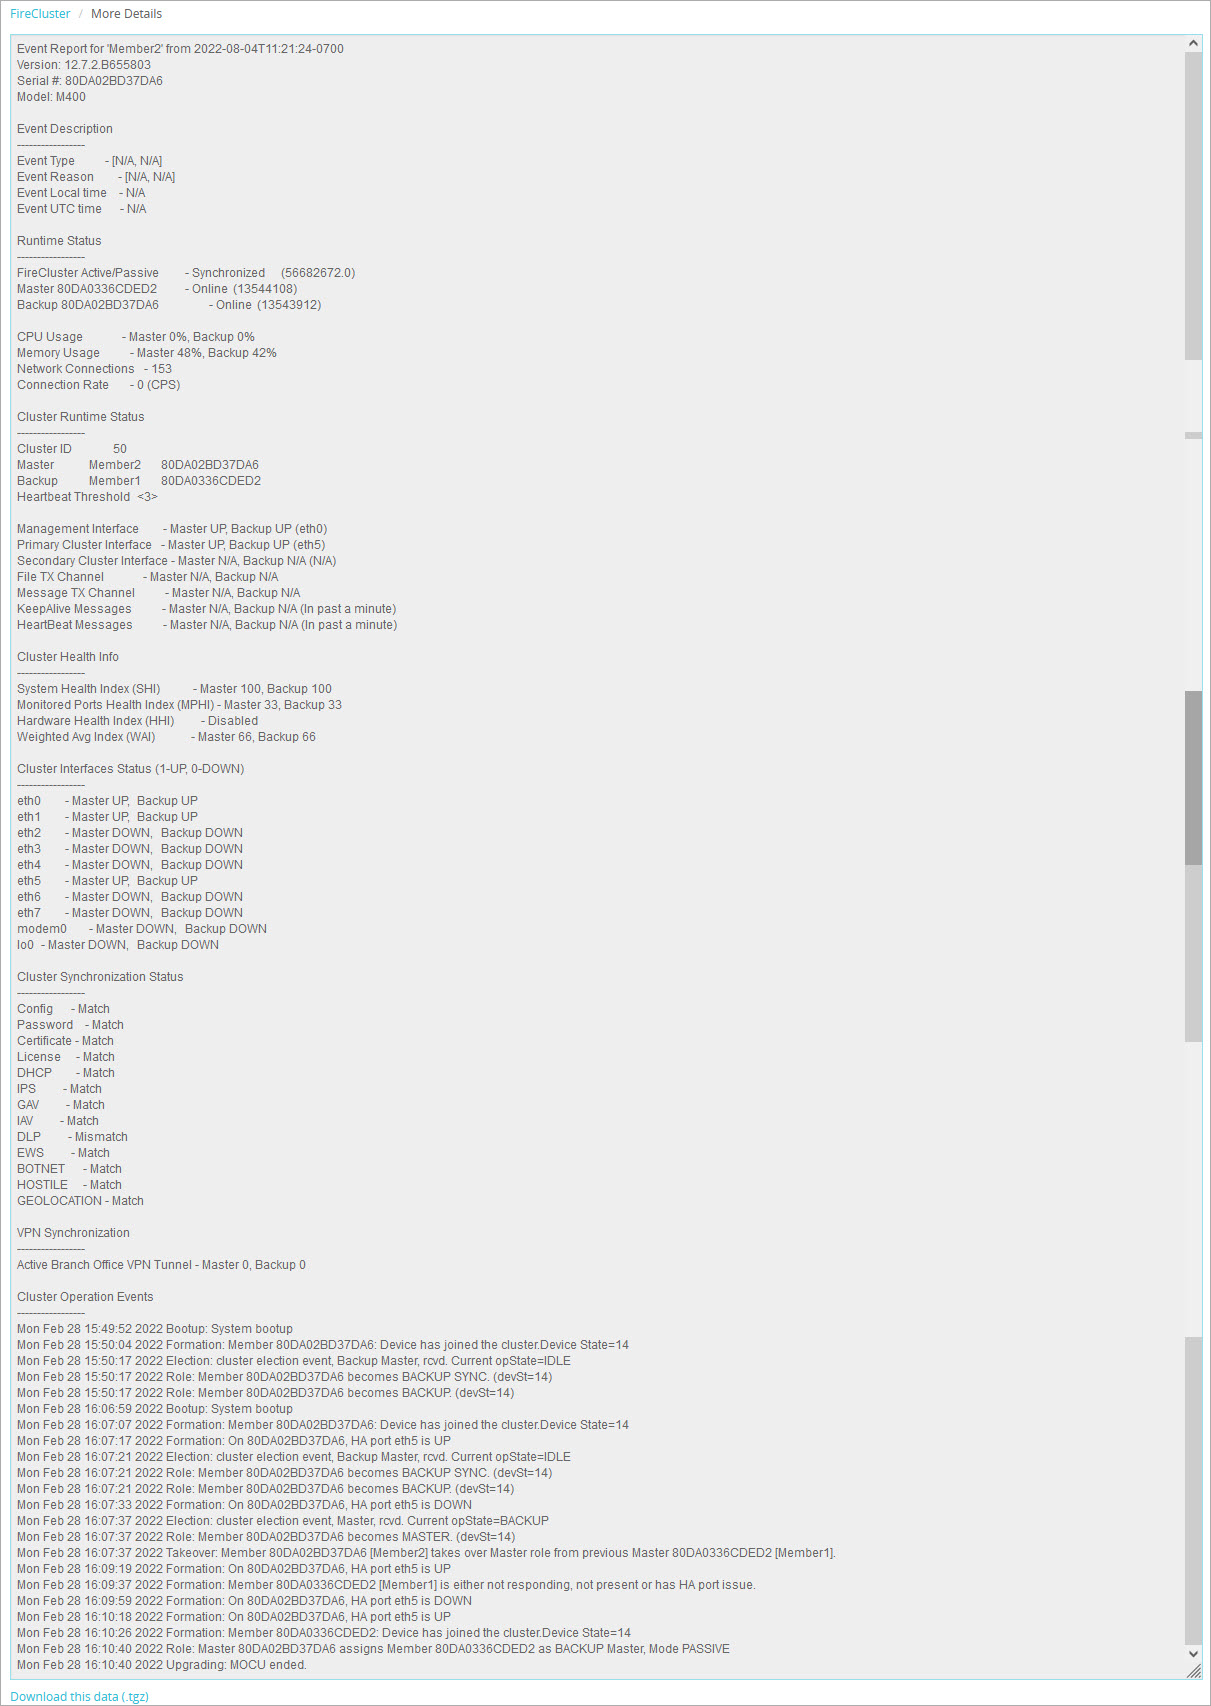
To see a detailed Event Status Report that you can download, click More Details.
Diagnostic
The Diagnostic tab shows you more details about each cluster member:
- Heartbeat — Whether a member received a heartbeat from the other member in the last 3 seconds. Both members send each other heartbeats.
- Management Interface and Primary Cluster Interface — Whether these interfaces are up.
- Monitored Interfaces — Whether interfaces monitored by the FireCluster are up. This includes External, Trusted, Optional, Custom, Link Aggregation, and VLAN interfaces. Modem and BOVPN virtual interfaces are not included. To see events related to monitored interfaces, click More Details.
- Health — Scores for the System Health Index, Monitored Ports Health Index, and Weighted Average Index. To see events related to system health, click More Details.
- Runtime objects— Objects in memory. The CONNTRACK runtime object reports the number of Firebox connections. In the Runtime Objects section, BOVPN Tunnels shows you the number of active BOVPN tunnels.
For more information about health indexes, see Monitor Cluster Health.
If the backup master is offline, data for that member is unavailable.

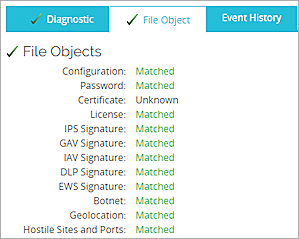
File Object
The File Object page shows you whether the configuration information matches for both members.

If the backup cluster member is offline, file object data is unavailable.

Event History
The Event History tab includes historical information about cluster events. To see events and data for a certain time range, select one of these options from the Cluster Member History drop-down list:
- Last day
- Last 7 days
- Last 14 days
- Last 30 days
- Last 3 months
The drop-down time range list applies to all events and data on the Event History tab. On this tab, you can see these details for the specified time range:
- Failovers — How many times a cluster master failed over to the backup master.
- Faults — How many fault reports the Firebox recorded.
- Cluster downtime — Days, hours, and minutes that both cluster members were down.
- Percentage — Percentage of time that both members were up, both members were down, or only a single member was up.
- Time — Days, hours, and minutes that both members were up, both members were down, or only a single member was up.

To see more information about an event, click the link in the Event column. An Event Status Report appears.
After you leave the FireCluster Diagnostics page, the time range resets to the default value of Last 7 days.
For more information about cluster failover, go to About FireCluster Failover.
For more information about faults, go to Manage Fault Reports.
Event Status Report
The Event Status Report is a text file that includes detailed information about your cluster.
The report includes this information:
- Event description (event type, reason, and time)
- Runtime status (how long members have been synchronized and up)
- Cluster health information (four health indexes)
- Interface status (up or down)
- Cluster synchronization status (whether the configuration, password, certificate, license, and DHCP match)
- VPN synchronization
- Cluster operation events (list of cluster events with time stamps)
You can download an XML version of the report that is compressed as a .GZ file.
- In the top section of the page, click More Details. Or, from the list of events, click an event.
The Event Status Report appears.

- Scroll to the bottom of the page.
- Click Download this data.
The rawdata.gz file downloads to your computer. - Use a third-party file archive program to unpack the file.
- To go back to the FireCluster Diagnostics page, click Back.