Applies To: Wi-Fi Cloud-managed Access Points (AP125, AP225W, AP325, AP327X, AP420)
Conversion Analytics comprises loyalty analytics and conversion analytics. Analyze integrates with Wi-Fi Cloud services and fetches visibility and association analytics data to populate these graphs.
For loyalty and conversion analytics to appear, you must have the Association Analytics option enabled in an SSID profile. For more information, see Manage SSID Profiles.
To view conversion analytics, select Analytics > Conversion.
The conversion graphs plot the number of visitors or the number of visits inside a store.
- Visitors is the total number of unique devices that visited your location.
- Visits are an aggregate count of unique devices that visited your location and the count of repeat visits for the same location.
For example, if you have two devices in range of a WatchGuard AP at two different times within the same day, the Visitors count will be 2, but the Visits will be counted as 4 in total.
The determination if the client is inside or outside your store is based on the conversion thresholds you set for the RSSI and session duration of the client. When a client device is within the configured RSSI threshold range for the configured session duration, the client device is considered inside the premises. By default, if a client connects to an AP and has an RSSI value between -30 dBm to -70 dBm continuously for at least five minutes, the connection is considered to be inside the store. The RSSI threshold and the time duration are configurable in the Conversion Thresholds tab under Admin > Settings. The new threshold value and time duration will be used to chart the graphs after the next successful data synchronization.
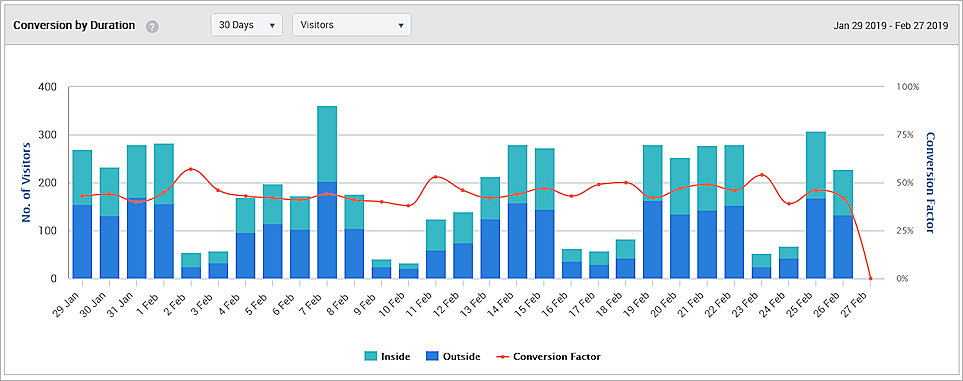
- Conversion by Duration — A day-based bar graph showing the number of visitors to the inside of the store and the number outside. Also a line graph plotting the percentage of visitors that was converted, that is, the percentage of visitors inside the store.

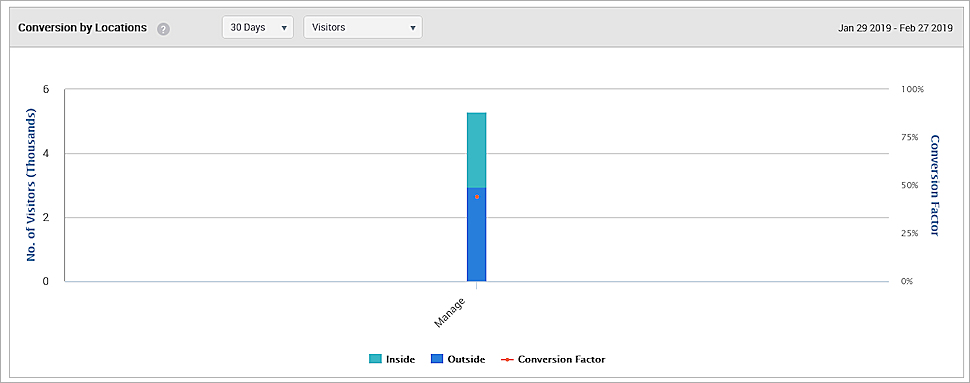
- Conversion Factor by Location — A location-based bar graph showing the number of visitors to the inside of the store and the number outside. Also a line graph plotting the percentage of converted visitors inside the store.

Loyalty Analytics
Loyalty Analytics displays the number of visitors based on their frequency of visits at different locations and different brands. To view loyalty analytics, select Analytics > Conversion.
These loyalty graphs are provided:
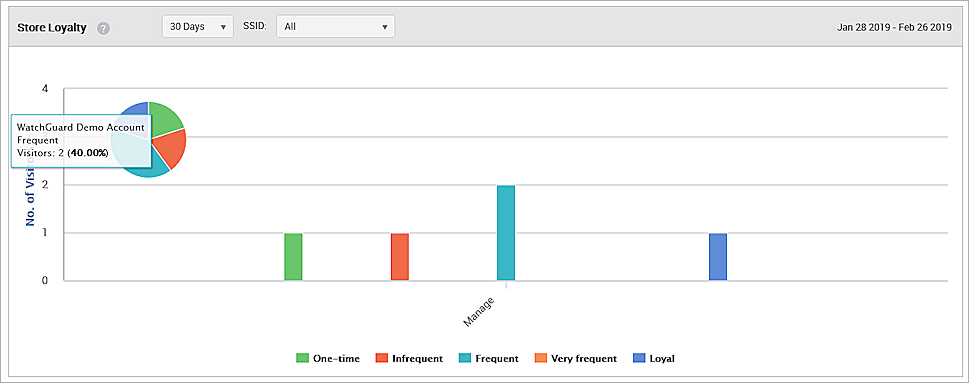
- Store Loyalty — This is a bar graph that shows the number of visitors for different visit frequencies who have accessed Wi-Fi one or more times during the specified duration at the selected location using the specified SSID. The graph plots the total number of guests based on the number of visits by each guest on different dates during the specified duration.
Multiple visits by a user on a single day is counted as one visit.
| Frequency | 7 days/14 days | 30 days |
|---|---|---|
| One-time | 1 visit | 1 visit |
| Infrequent | 2 visits | 2-4 visits |
| Frequent | 3 visits | 5-7 visits |
| Very frequent | 4 visits |
8-15 visits |
| Loyal | More than 4 visits |
More than 15 visits |
For the selected location, the bar graphs are displayed for each child location. An aggregated pie chart for the selected location and its immediate children is displayed.

- Brand Loyalty — For brand loyalty, the number of visitors for different visit frequencies is plotted based on the SSID accessed by the guest. The graphs are plotted based on the data from all locations and is not specific to the location selected on the tree. You can obtain the brand loyalty data for all SSIDs only at the root level. The data uniqueness is decided by combining the MAC address and the SSID. The visit frequency legend is the same as that used for Store Loyalty. In the case of brand loyalty, the data used to plot the pie chart is an inclusive data for the selected location and not an aggregated one as in the case of store loyalty.
For example:
1. If a client has connected to SSID1 many times at the same store (location) on the same day, then the contribution of the client is considered as one visitor with one visit (this is the One-time category on the chart) .
2. If a client has connected to SSID1 at store A and also connected to SSID2 at store B on the same day or a different day, the contribution of the client is considered as one visitor with one visit at the respective store.
3. If a client has connected to SSID1 at store A and the same SSID at store B on the same day or a different day, the contribution of the client is considered as one visitor with two visits (the Infrequent category on the chart) at both stores.
