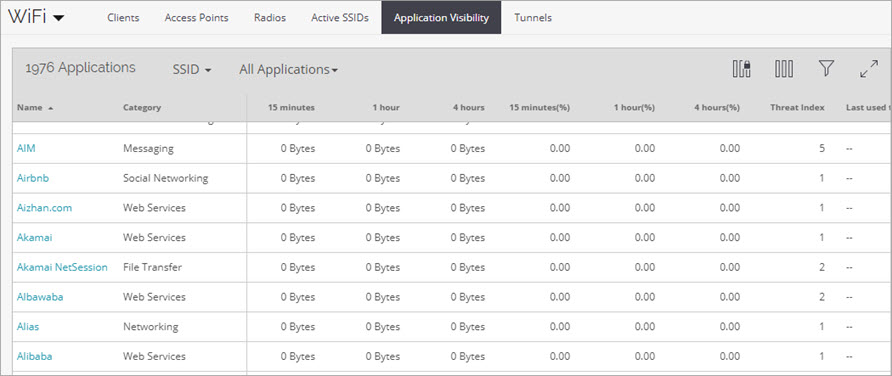
Monitor Application Visibility
Applies To: Wi-Fi Cloud-managed Access Points (AP125, AP225W, AP325, AP327X, AP420)
You can freeze columns, add or remove columns, filter the display, and switch to full screen mode using the icons at the top-right of the page. For more information, see Table Actions for Monitor Pages.

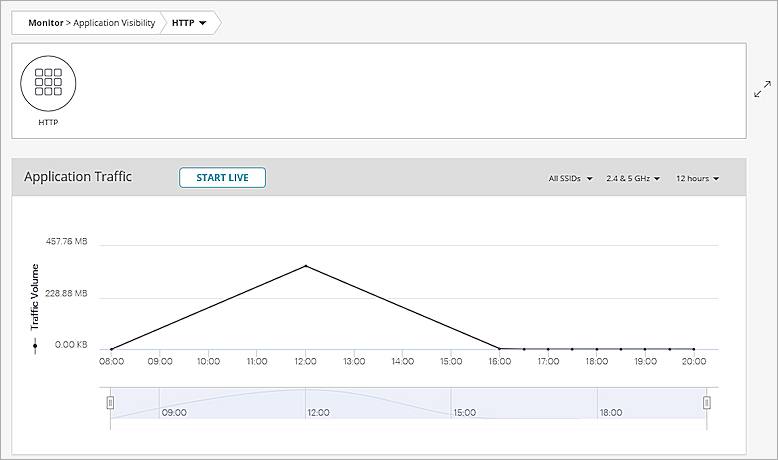
Click an application to see a line graph that plots the usage of the application over the selected period of time, and a list of the top ten clients using the selected application.

Application Traffic
The Application Traffic widget indicates the data usage of the selected application over a period of time. The data calculation is based on clients using the application on the selected folder or floor.
You can filter the data by the SSID, frequency band, and time interval.
To see live data use for the application, click Start Live. A line graph appears that displays traffic volume of the application over time. Click Stop Live when finished.

Clients with Most Application Traffic
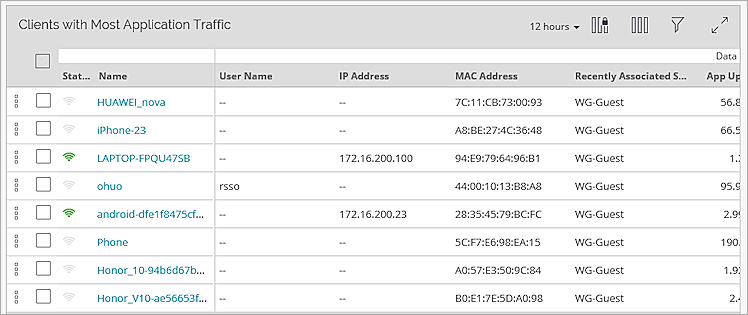
The Clients with Most Application Traffic widget provides a list of the clients with the highest usage for the selected application. Click a client to see detailed information.
Filter the data in the table with the tools provided in the top-right corner of the widget. For more information, see Table Actions for Monitor Pages.
