Related Topics
Run Diagnostic Tasks to Learn More About Log Messages
You can use the Firebox System Manager (FSM) Diagnostic Tasks tool to learn more about a log message, or to review information in your Firebox log messages to help you debug problems on your network. You can ping the source or destination IP address, trace the route to the source or destination IP address, look up DNS information for an IP address, or see information about the packets transmitted across your network (TCP dump). You can include arguments in your task details to narrow the results. You can also run the VPN Diagnostic Report to see configuration and status information for a VPN gateway and the associated branch office VPN tunnels.
Run Diagnostic Tasks
From Firebox System Manager, you can run diagnostic tasks to review information in all the log messages from your Firebox. This can help you debug problems on your network.
- On the Traffic Monitor tab, right-click a message and select Diagnostic Tasks.
Or, select Tools > Diagnostic Tasks.
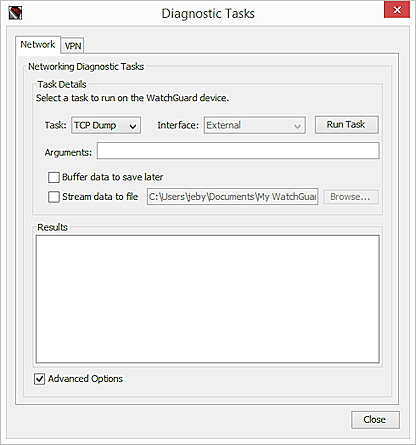
The Diagnostic Tasks dialog box appears, with the Network tab selected.

- From the Task drop-down list, select the task to run.
- Ping IPv4
- Ping IPv6
- traceroute
- DNS Lookup
- TCP Dump
If you select Ping, traceroute, or DNS Lookup, the Address text box appears.
If you select TCP Dump, the Interface drop-down list appears.
- In the Address text box, type an IP address or host name.
Or, from the Interface drop-down list, select an interface to include in the search. - To reduce the number of results you see, select the Advanced Options check box.
The Arguments text box appears.

- In the Arguments text box, type the arguments to include in the search.
Make sure you include the value you specified in either the Address text box or the Interface drop-down list. If you do not include this value in the arguments you type, the search does not run.
To see a list of available arguments, place your cursor over the Arguments text box, or keep the text box empty and click Run Task.Ping IPv4 arguments
ping [-LRUbdfnqrvVaA] [-c count] [-i interval] [-w deadline]
[-p pattern] [-s packetsize] [-t ttl] [-I interface or address]
[-M mtu discovery hint] [-S sndbuf]
[ -T timestamp option ] [ -Q tos ] [hop1 ...] destination
Ping IPv6 arguments
ping6 [-LUdfnqrvVaA] [-c count] [-i interval] [-w deadline]
[-p pattern] [-s packetsize] [-t ttl] [-I interface]
[-M mtu discovery hint] [-S sndbuf]
[-F flow label] [-Q traffic class] [hop1 ...] destination
traceroute arguments
6.1.3 GOLD+emf_prototrace0.2: TrACESroute Usage: traceroute [-adnruvAMOQ] [-w wait] [-S start_ttl] [-m max_ttl] [-p port#] [-q nqueries] [-g gateway] [-t tos] [-s src_addr] [-g router] [-I proto] host [data size]
-a: Abort after 10 consecutive drops
-d: Socket level debugging
-g: Use this gateway as an intermediate hop (uses LSRR)
-S: Set start TTL (default 1)
-m: Set maximum TTL (default 30)
-n: Report IP addresses only (not hostnames)
-p: Use an alternate UDP port
-q: Set the number of queries at each TTL (default 3)
-r: Set Dont Route option
-s: Set your source address
-t: Set the IP TOS field (default 0)
-u: Use microsecond timestamps
-v: Verbose
-w: Set timeout for replies (default 5 sec)
-A: Report AS# at each hop (from GRR)
-I: use this IP protocol (currently an integer) instead of UDP
-M: Do RFC1191 path MTU discovery
-O: Report owner at each hop (from DNS)
-P: Parallel probing
-Q: Report delay statistics at each hop (min/avg+-stddev/max) (ms)
-T: Terminator (line end terminator)
-U: Go to next hop on any success
DNS Lookup
dnslookup destination
TCP Dump
tcpdump [-aAbdDefIKlLnNOpPqRStuUvxX] [ -B size ] [ -c count ]
[ -E algo:secret ] [ -i interface ] [ -M secret ] [ -s snaplen ]
[ -T type ] [ -y datalinktype ] [ -z command ]
[ expression ]
- Click Run Task.
The task information appears in the Results list and the Stop Task button appears. - To stop the diagnostic task, click Stop Task.
- Click Close to close the Diagnostic Tasks dialog box and return to Traffic Monitor.
Ping or Trace Route for a Traffic Log Message
You can run a ping or traceroute task on the source or destination IP address for a specific traffic log message to refine the information you see for that message.
- On the Traffic Monitor tab, select a log message.
- Right-click the message and select a task:
- Source IP address > Ping
- Source IP address > Trace Route
- Destination IP address > Ping
- Destination IP address > Trace Route
The Diagnostic Tasks dialog box appears with the information for the selected log message and task inserted in the appropriate fields. The selected task starts automatically.
- To reduce the number of results you see, select the Advanced Options check box.
The Arguments text box appears. - In the Arguments text box, type the arguments and the IP address you want to include in the search. Make sure you type the IP address from the Address text box again.
To see a list of available arguments, place your cursor over the Arguments text box, or keep the text box empty and click Run Task. - After you have typed any arguments, click Run Task.
The task information appears in the Results list and the Stop Task button appears. - To stop the diagnostic task, click Stop Task.
Find the IP Address for a Host Name
From your Firebox, you can use the DNS Lookup task to find which IP address a host name resolves to.
- From the Task drop-down list, select DNS Lookup.
The Address text box appears. - In the Address text box, type the host name.
- Click Run Task.
The IP address for the host name you specified appears in the Results list.
Download a PCAP File
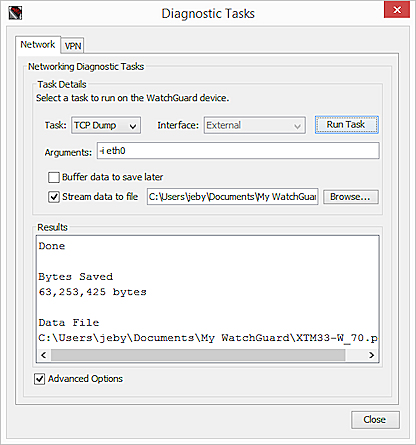
From the Diagnostic Tasks dialog box, you can download a packet capture (.PCAP) file to help you diagnose problems with the traffic on your network. The .PCAP file captures the results of the most recent TCP dump task that you run so you can review the protocols found in the task results outside of Traffic Monitor. If you do not save the TCP dump results to a .PCAP file, the results of the TCP dump task are cleared when you run a new diagnostic task. You can save the TCP dump data to a file on your computer as the task runs, or you can save the results on your Firebox and download the file later.
When you enable the Advanced Options to include arguments in the TCP dump task, you must always specify an interface. This can be a physical interface on the Firebox (such as, eth0), a Link Aggregation interface (such as, bond0), a wireless interface (such as, ath0), or a VLAN interface (such as, vlan10). If you specify a VLAN or bridge interface, and the traffic matches a proxy rule, TCP dump only captures the first incoming packet on that interface. To capture all packets, you must run the TCP dump task on the physical interface from where the packets originate.
If you run the TCP dump task for an XTM 2 Series device with subscription services enabled, you might see a reduction in the performance of your Firebox. When the task completes, the performance of your device returns to normal.
About TCP Dump Arguments
When you run the TCP dump task, you must specify the interface on which to run the task. You an also include expressions in the task arguments to filter for specific traffic.
To specify the interface, you include the -i argument and the interface name and number. For example:
-i eth1 — Physical interface #1
-i ath1 — Wireless interface #1
-i br1 — Bridge interface #1
-i bond1 — Link aggregation interface #1
-i vlan1 — VLAN interface #1
To build an expression to filter the traffic from the interface you specify, you can use any of the standard TCP dump keywords and operators. Some of the common keywords and operators are:
host — Only include traffic to or from the specified host IP address.
net — Only show traffic to or from the IP addresses in the specified subnet. For example, for 10.0.1.0/24, type 10.0.1.
port — Only show traffic with either a source or destination of the specified port.
portrange — Only show traffic from the specified range of ports.
ip proto — Only show traffic from the specified protocol. For example, for ESP packets, type 50.
src or dst — Use with the keywords host or port to specify the source or destination.
tcp or udp — Use with the keywords port or portrange to specify the protocol.
and / or — Use to combine expressions.
For a complete list of the available keywords and detailed examples of how to create filter expressions, see the PCAP-Filter manpage at http://www.tcpdump.org/manpages/pcap-filter.7.html.
Examples of TCP dump arguments:
-i eth1 host 10.0.1.25 and dst port 80
Show only traffic on interface eth1, to or from 10.0.1.25 with destination port 80.
-i eth0 tcp port 25
Show only traffic on interface eth0, to or from TCP port 25.
-i vlan1024
Show only traffic tagged with VLAN 1024.
-i eth0 udp port 500 or ip proto 50
Show all UDP port 500 or ESP packets for the eth0 interface.
-i eth2 src 10.0.1.100 and dst 10.0.2.25
Show all traffic from 10.0.1.100 to 10.0.2.25 on the eth2 interface.
Save TCP Dump Data Directly to a PCAP File
To save the TCP dump data in a .PCAP file as the task runs:
- On the Traffic Monitor tab, right-click a message and select Diagnostic Tasks.
Or, select Tools > Diagnostic Tasks.
The Diagnostic Tasks dialog box appears, with the Network tab selected. - From the Task drop-down list, select TCP Dump.
The Interface drop-down list appears. - Select the Advanced check box.
The Advanced options appear.

- In the Arguments text box, type the parameters for the search. Parameters are case sensitive.
For example, to capture PCAP data for the default external interface, type -ieth0. - Select the Stream data to a file check box.
- Click Browse to specify a location to save the .PCAP file and a name for the file.
- Click Run Task.
The TCP Dump task runs . TCP dump data does not appear in the Results list.

- When the TCP dump has collected enough results, click Stop Task.
The TCP dump stops automatically if the file reaches either the maximum allowed size for your computer, or the amount you specified in the Arguments text box.
The TCP dump task stops and the .PCAP file is saved to the specified location.

After you have saved the .PCAP file, you can open the file in a third-party application, such as Wireshark, and review the included protocols to resolve issues in your network configuration.
Save TCP Dump Data on Your Firebox
You can also select to capture the TCP dump data on your Firebox and then save it as a .PCAP file on your computer.
From the Diagnostic Tasks dialog box:
- From the Task drop-down list, select TCP Dump.
The Interface drop-down list appears. - Select the Advanced check box.
The Advanced options appear. - In the Arguments text box, type the parameters for the search. Parameters are case sensitive.
For example, to capture .PCAP data for the default external interface, type -ieth0. - Select the Buffer data to save later check box.
- Click Run Task.
The TCP dump task runs. Data from the TCP dump appears in the Results list, and the Stop Task button appears.

- When the TCP dump has collected enough results, click Stop Task.
The TCP dump also stops automatically when all results are captured.
The TCP dump task stops and the Save Pcap file button appears.

- Click Save Pcap file to specify a location to save the .PCAP file and a name for the file.
The maximum size of the .PCAP file is 30 MB. If your Firebox has limited memory, the size of the .PCAP file is constrained relative to the available memory available on your Firebox.
Copy a Log Message IP Address
You can copy the source or destination IP address for a log message in Traffic Monitor to paste in another program or dialog box.
- On the Traffic Monitor tab, select a log message.
- Right-click the message and select a task:
- Source IP address > Copy Source IP address
- Destination IP address > Copy Destination IP address
The selected IP address is copied to the system clipboard.
Get More Information About IPS Signatures in Traffic Log Messages
If you have enabled logging for Intrusion Prevention Service (IPS) signatures, you can use Traffic Monitor to find more information about the signature IDs associated with traffic log messages.
On the Traffic Monitor tab:
- Select a traffic log message with a signature ID, such as Detect IPS.
- Right-click the log message and select Lookup Signature Information.
The WatchGuard signature website appears with details for the signature.
For more information about IPS and IPS signatures, see About Intrusion Prevention Service and Show IPS Signature Information.
Run a VPN Diagnostic Report
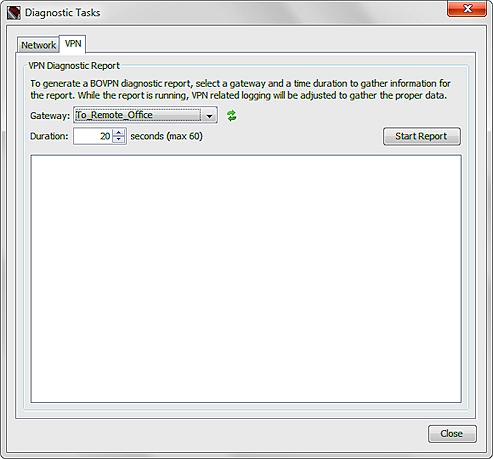
To see configuration and status information for a VPN gateway and the associated branch office VPN tunnels, you can run a VPN Diagnostic Report. When you run a report, the Firebox temporarily increases the log level for the selected gateway.
In the Diagnostic Tasks dialog box:
- Select the VPN tab.

- From the Gateway drop-down list, select a VPN gateway.
- To refresh the VPN gateways included in the Gateway drop-down list, click
 .
. - In the Duration text box, type or select the number of seconds to run the VPN Diagnostic Report.
- Click Start Report.
The diagnostic task starts and generates the report.

The Firebox collects log messages for the duration you specified. When the task is completed, details about the gateway and tunnel configuration and information about the status of any active tunnels for the selected gateway appear in the Results section. The log level is then returned to the previously set level.

You can also run the VPN Diagnostic Report from the FSM Front Panel tab:
- Expand the Branch Office VPN Tunnels tree.
- Select a VPN interface or gateway.
- Right-click the selected VPN interface or gateway and select VPN Diagnostic Report.
The Diagnostic Tasks dialog box appears with the VPN tab selected. The VPN Diagnostic Report runs for the selected gateway, for a duration of 20 seconds. - To run the report again, click Start Report.
For more information about the diagnostic report for VPNs, see Use the VPN Diagnostic Report.
See Also
Device Log Messages (Traffic Monitor)
About Logging, Log Files, and Notification
See Log Messages & Reports in WebCenter