Related Topics
About the Performance Console
The Performance Console is a utility program you can use to make graphs that show how different parts of the Firebox operate. To collect the information, you define counters that identify the information used to make the graph.
Start the Performance Console
To start the Performance Console, from Firebox System Manager:
- Click
 .
.
Or, select Tools > Performance Console.
The Add Chart dialog box appears. - To close the Add Chart dialog box and view the Performance Console, click Cancel.
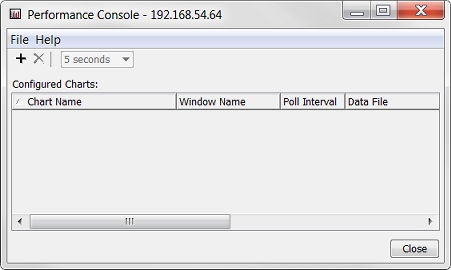
The Performance Console dialog box appears.

- Or, add a chart and define performance counters.
For more information about the Performance Console and performance counters, see Define Performance Counters.
Make Graphs with the Performance Console
To make graphs in the Performance Console:
For more information about the categories for counters, see the Types of Counters section.
- Modify the chart or add a new one, as described in Add Charts or Change Polling Intervals.
Types of Counters
You can monitor these types of performance counters:
System Information
Shows how the CPU is used.
Interfaces
Monitor and report on the events of selected interfaces. For example, you can set up a counter that monitors the number of packets a specified interface receives.
Policies
Monitor and report on the events of selected policies. For example, you can set up a counter that monitors the number of packets that a specified policy examines.
VPN Peers
Monitor and report on the events of selected VPN policies.
Tunnels
Monitor and report on the events of selected VPN tunnels.
Stop Monitoring or Close the Window
You can stop the monitor to save resources and restart it at different time.
- Click Stop Monitoring.
The Performance Console no longer receives data for this counter. - Click Close to close the chart window.