Related Topics
Add Charts or Change Polling Intervals
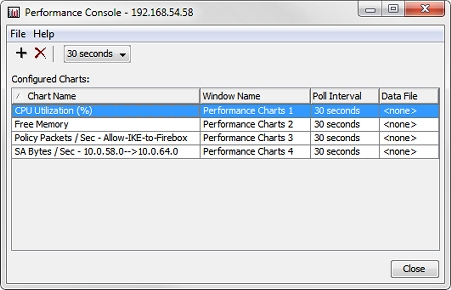
The main Performance Console window shows a table with all configured and active performance counters. From this window, you can add a new chart or change the polling intervals for configured counters.
- Start Firebox System Manager for your device.
- Click
 .
.
The Performance Console window appears.

Add a New Chart
To add a new chart:
- Click
 .
.
Or, select File > Add Chart.
The Add Chart dialog box appears. - Define Performance Counters for the chart.
Change the Polling Interval
To change the polling interval for one performance console:
- From the Configured Charts list, select a chart name.

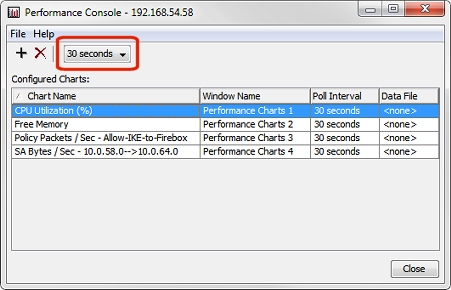
- From the polling interval drop-down list, select the new duration between polls.
The new frequency value appears in the Poll Interval column.
Delete a Chart
To delete a chart:
- From the Configured Charts list, select a chart name.
- Click
 .
.
Or, select File > Delete Chart.
A confirmation dialog box appears. - Click Yes to delete the chart.