Applies To: WatchGuard Advanced EPDR
To more easily analyze the data in investigation graph windows, you can view detailed event telemetry in the form of graphs. In investigation graph windows, events are illustrated with nodes and arrows to show entities and the relationship between them. The information you view in a graph is equivalent to the data shown in advanced SQL queries.
To open the investigation graph window, in the Endpoint Security management UI:
- To open computer details, select Computers, then select a computer.
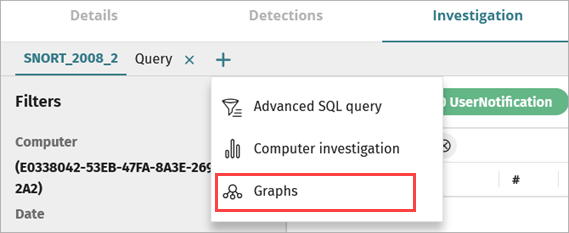
- On the Investigation page, click
 .
. 
-
Select Graphs.
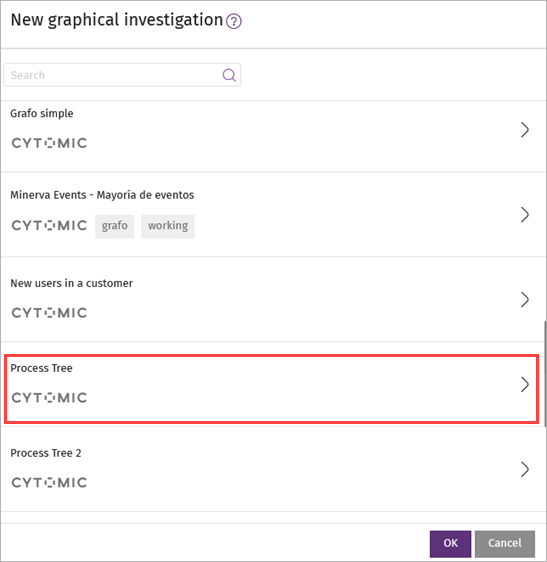
The New Graphical Investigation dialog box opens with available graph templates.
- Select the Process Tree template.
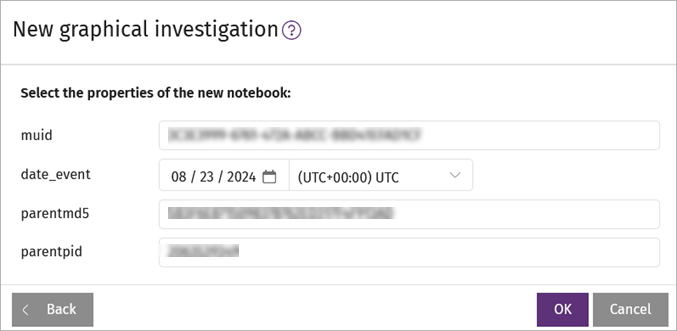
The properties for the new graph open.
- Specify properties for the new notebook:
- muid — Enter the unique identifier for each computer you want to investigate.
- date_event — Enter the date when the event you want to investigate occurred. The graph shows events from the day before to the day after the specified date.
- parentmd5 — Enter the MD5 hash code for the parent process.
- parentpid — Enter the parent process ID for the specific execution instance of the program. This will show as the start node on the graph.
- Click OK.
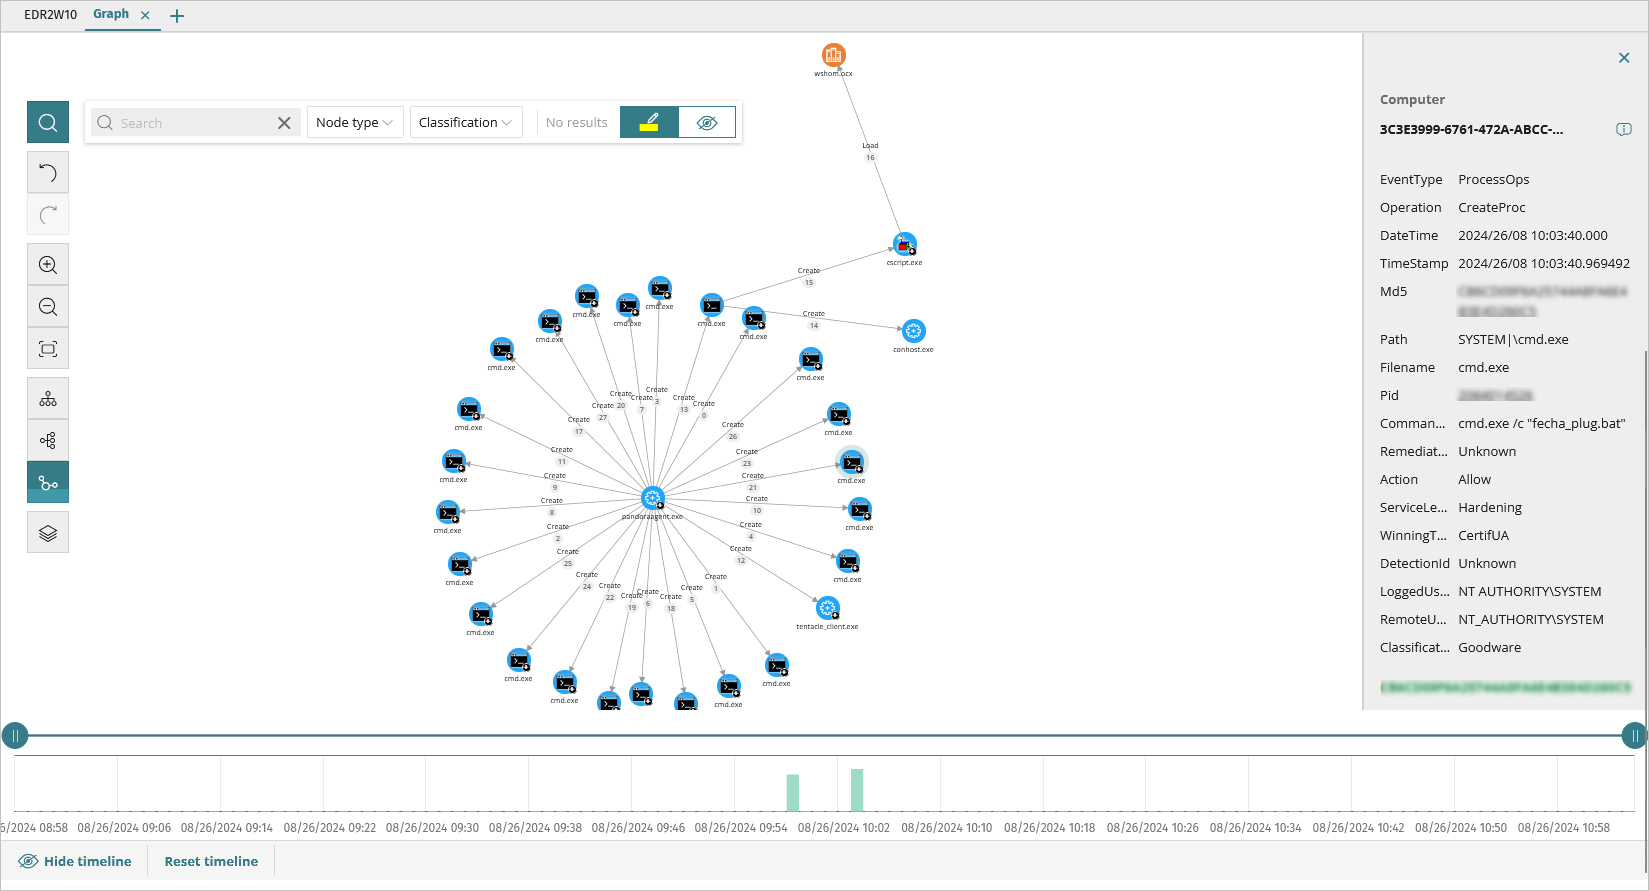
The investigation graph window opens.
About the Investigation Graph Window
The investigation graph window is divided into these areas:
- Graph — Shows a set of events with nodes and arrows to illustrate entities and the relationship between them. The numbers on the arrows indicate the order in which the events were recorded.
- Information Panel — On the right side of the window, the information panel shows information about the selected node or line.
- Graph Toolbar — On the left side of the window, the toolbar enables you to change the appearance of the graph, undo and redo changes, and search for or filter nodes. For more information, go to Configure Graph Settings.
- Timeline — Below the graph, the timeline shows a histogram with green bars that represent events carried out by a threat. You can magnify or reduce the size of the interval in which the events shown occurred so you can see them more clearly. You can also hide, show, or reset the timeline. For more information about how to use the timeline, go to View Timeline.
For information about how to configure the graph settings, go to Configure Graph Settings.
For information about the colors, panels, and other graph features that provide information on entities and relationships between them, go to About Nodes and Arrows in Investigation Graphs.