You can use the built-in security monitoring in Kaseya VSA to create alarms and tickets, run scripts, and set up email notifications for security events.
Alarms and tickets notify you about security events for selected devices, and scripts can take immediate action to isolate machines. For example, if the Endpoint Security Plug-in for Kaseya VSA detects an indicator of attack, or a PUP executed on a device, a script can call the WatchGuard Endpoint Security API and isolate the affected device immediately.
Create Alerts, Tickets, and Run Scripts
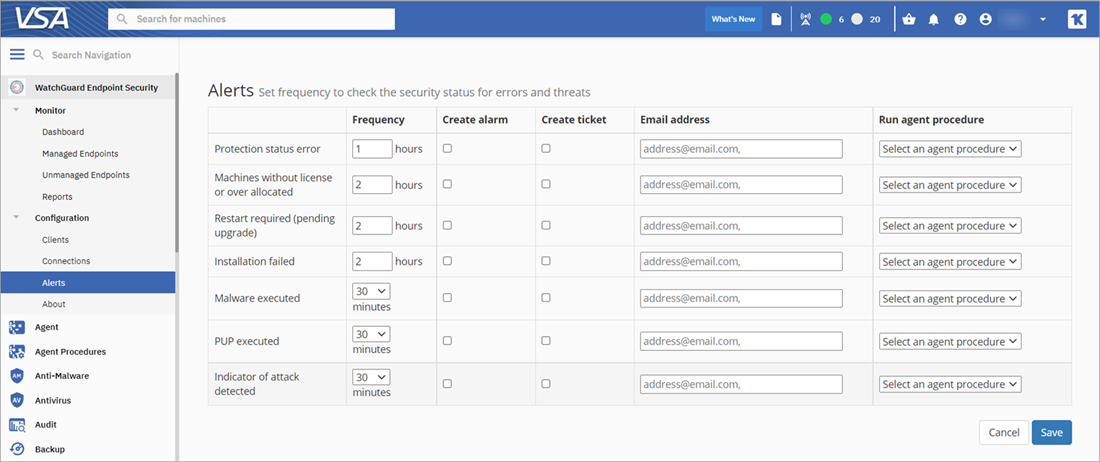
You can set up alerts and tickets for these security events:
- Protection status errors
- Devices without licenses or those that are overallocated
- Restart required (pending upgrade)
- Installation failed
- Malware executed
- PUP executed
- Indicator of attack detected
Before You Begin
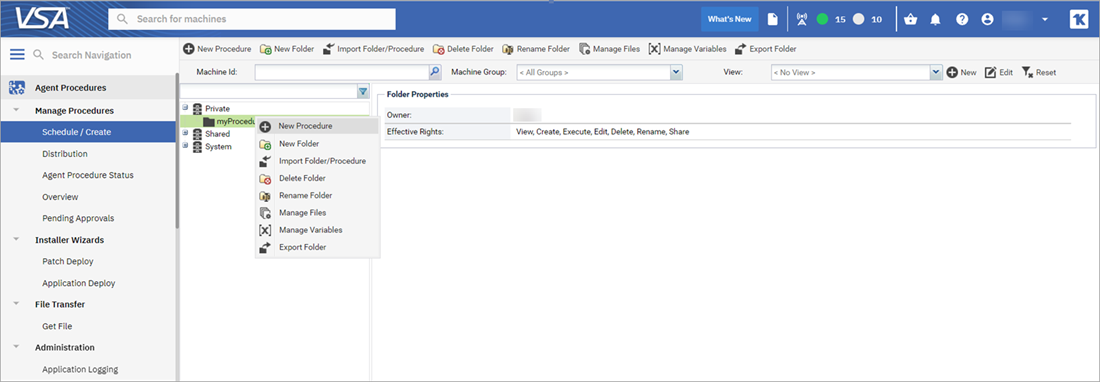
To run agent procedures (scripts) in the Endpoint Security Plug-in for Kaseya VSA, you must first create agent procedures in the Kaseya VSA UI. In the Agent Procedures section, on the Schedule/Create page, you can create and manage your agent procedures. For more information, go to Agent Procedures Overview.

To create alerts in the Endpoint Security Plug-in for Kaseya VSA:
- Select Configuration > Alerts.
The Alerts page opens.

- To create an alarm, select the Create Alarm check box.
- To create a ticket, select the Create Ticket check box.
- In the Email Address text box, enter your email address. Type a comma separated list for multiple email addresses.
- To run an agent procedure, select a procedure from the Select an Agent Procedure drop-down list.
- Click Save.
When the Default Configuration check box on the Alerts page cannot be edited, this indicates you have the default configuration.
Manage Alerts
After you configure alerts on the Alerts page, you can view and manage the alerts in the Kaseya VSA UI.
To view your alerts:
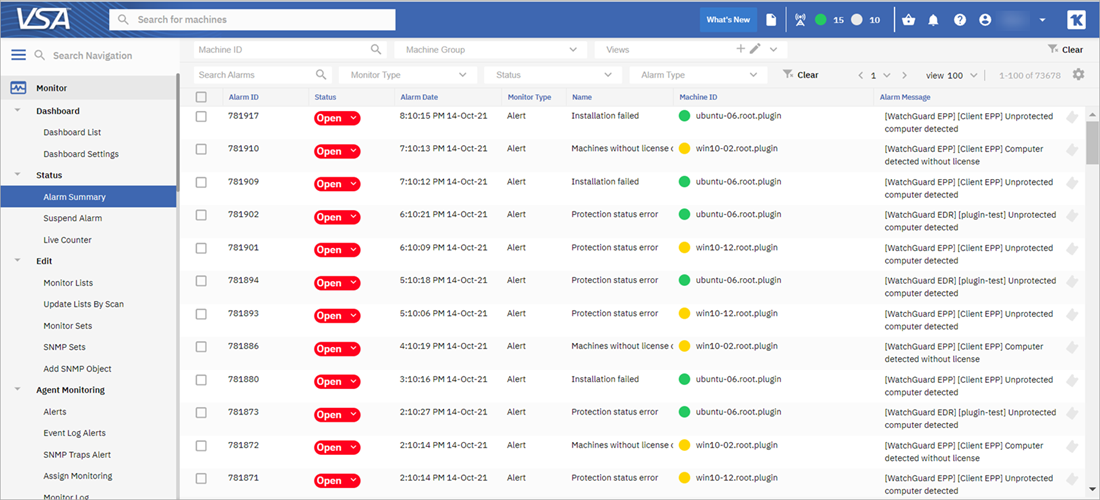
- In the Kaseya VSA UI, select Monitor > Status > Alarm Summary.
The Alarm Summary page opens.

The Alarm Summary page has these columns:
- Alarm ID — Number of the alarm.
- Status — Shows the status of the alarm. The alarm can be open or closed.
- Alarm Date — Shows the date and time of the alarm.
- Monitor Type — Shows the type of monitoring. For example, alert.
- Name — Shows the name of the alarm.
- Machine ID — Shows the computer ID associated with the alarm.
- Alarm Message — Shows a detailed message about the type of threat detected on a specific device.
To manage your alerts, select one or more alerts and select one of the following actions:

- Set the status to open or closed
- Add notes
- Create tickets
- Delete alarms