
Related Topics
Manage TDR Incidents
An Incident is a group of indicators related to activity on a specific host. ThreatSync analytics identifies an incident when several indicators with a high threat score are reported for the same host. An incident can contain indicators reported by a Host Sensor, a Firebox, or both.
From the Incidents page, an Operator can see which hosts have the highest severity indicators, and can quickly take action on all the indicators for each host. An incident provides an aggregate view of the indicators on a host.
On the Incidents page in the TDR web UI, you can expand an incident to:
- See all indicators for that host
- See which indicators contribute to the incident score (identified by
 )
) - See the timeline of when each indicator was reported
- Execute an action to manage threats in an indicator
ThreatSync analytics uses a proprietary set of algorithms to determine a score for each incident based on the scores of the indicators on that host. Only the indicators with critical or high threat scores contribute to the incident score. Indicators with a low threat score are not included in the calculation of incident score. In the incident list for each indicator, ![]() identifies that an indicator contributes to the final ThreatSync score for the incident. For more information, see About TDR Threat Scores.
identifies that an indicator contributes to the final ThreatSync score for the incident. For more information, see About TDR Threat Scores.
You can also configure policies to automatically complete actions to manage a threat. For more information, see Configure TDR Policies.
See Incidents
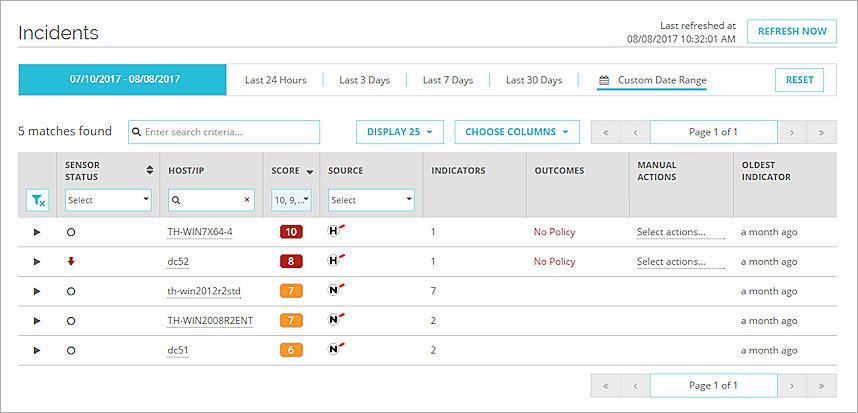
By default, the Incidents page shows incidents with a threat score of six or higher.
To see current incidents:
- Select ThreatSync > Incidents.
The Incidents page appears with the filter set to show all incidents with a score of 6 or higher identified in the last 24 hours.
- To increase the date range, select the range at the top of the page.
- To see the indicators in an incident. click
 .
.
The incident expands to show the list of indicators. the list is automatically filtered to show only the indicators that contribute to the incident score.
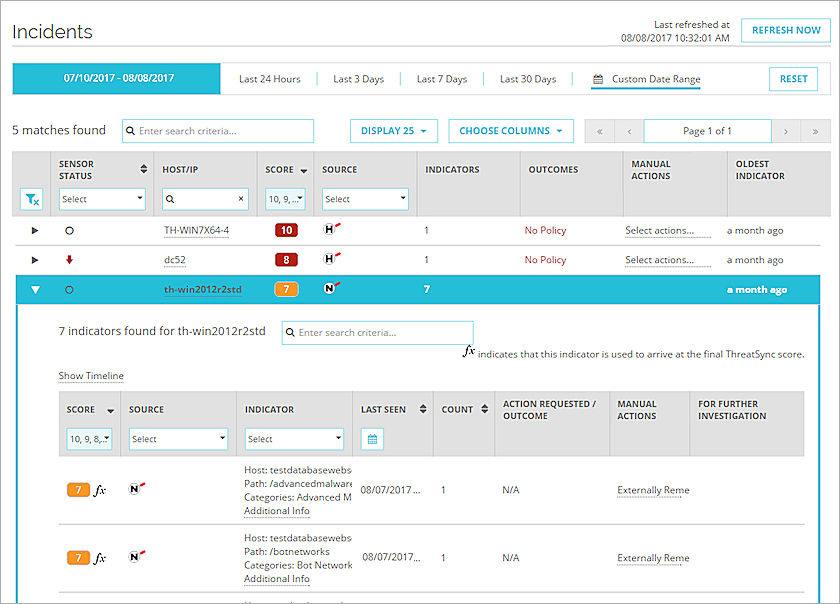
From the expanded Incidents list for an indicator, you can complete the same actions as on the Indicators page.
- To see additional details about an indicator, in the Indicator column, click Additional Info. The indicator details gives more information about the indicator and the reason for the score.
- To take remediation action, in the Manual Actions column, click Select actions the action. You can take the requested action, mark the indicator as externally remediated, or add it to the Whitelist. If a file has been previously quarantined, you can select the action to remove the file from quarantine and add it to the whitelist. For more information, see Remove a File from Quarantine.
- To look up the MD5 value for this indicator on Google, VirusTotal, or MetaScan, in the For Further Investigation column, click one of the links.
- Too see the incident timeline, follow the instructions in the next section.
For more information about indicator status, details, actions and investigation, see Manage TDR Indicators.
See the Incident Timeline
To see the indicators for an incident on a timeline:
- To see the indicators for an incident, click .
- Click Show Timeline.
The timeline appears above the list of indicators for the incident.
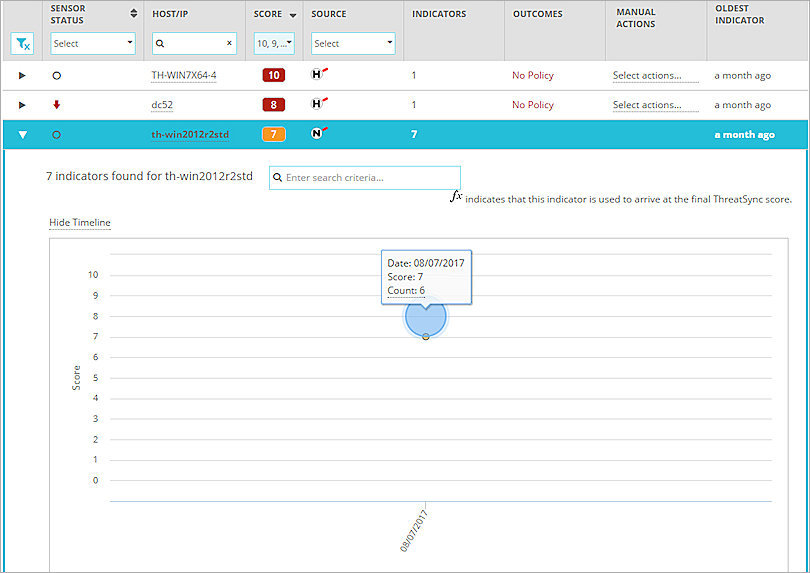
In the timeline:
- The left scale is the Indicator threat score.
- The size of each bubble shows the number of Unresolved Indicators for that day.
- The color of each bubble is the same as the color of the scores on the Incidents and Indicator pages.
To see more information about a timeline, you can zoom in on a section of the timeline and click on or hover over a bubble.
To zoom in on a section of the timeline:
- Click and drag your mouse pointer over an area in the chart.
The chart size changes to show the selected area. - Click Reset Zoom to zoom out to the full timeline view.
To see more detail about a bubble:
- Move the mouse pointer over the bubble.
The bubble changes to blue. A tooltip appears with the Date, Score, and Count. The Count is the number of indicators with the score shown. - To see only the list of indicators for a bubble, click the bubble.
Or, in the tooltip, click Count.
The list of indicators below the timeline is filtered for the score and date of the selected bubble.
To hide the timeline, click Hide Timeline.