
Related Topics
Manage TDR Indicators
In Threat Detection and Response, indicators are events received from Host Sensors and Fireboxes on your network and scored by the ThreatSync analytics engine. On the Indicators page, Operators can see all indicators in the system, create quick bar and pie charts, and complete manual actions across hosts.
See Indicators
On the Dashboard page in the TDR web UI, you can see a summary of the indicators, and quickly go to a filtered view of the Indicators page. For more information, see TDR Dashboard. You can also go directly to the Indicators page and see all indicators.
- Select ThreatSync > Indicators.
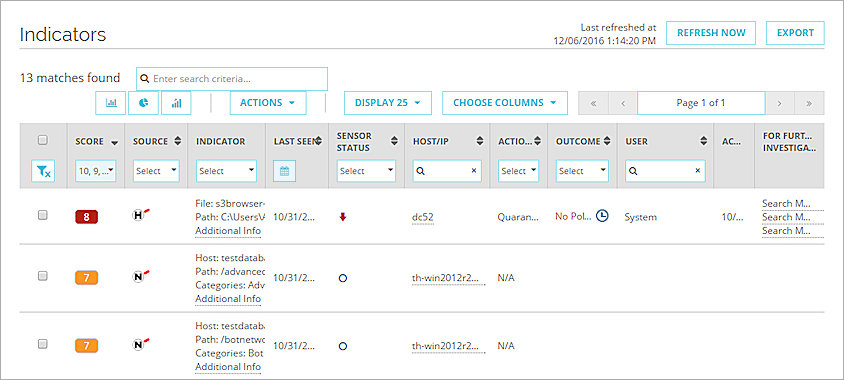
By default, the Indicators page shows indicators with a score of 6 or higher last seen in the last 24 hours.
- To search for indicators, in the Search text box type a word or value to search for. The search can match text in a file name, MD5 value, IP address, DNS name, or URL associated with an indicator.
- Use the column headings to change or clear the filters.
- To clear all filters, click
 .
. - To apply a filter, select the controls in the column headings.
- To clear all filters, click
The Indicators list shows a list of indicators with status information and requested actions. For each indicator, you can see this information:
- Score — The threat score for this indicator. By default, this column is filtered to show scores of 6 or higher.
For more information, see About TDR Threat Scores. - Source — The source of the indicator: Host Sensor (
 ) or Firebox (
 ).
). - Indicator — The indicator details. You can filter this column by indicator type, as described in the next section. To see more details, click Additional Info.
- Last Seen — The last time the indicator was received from the Host Sensor. By default, this column is filtered to show indicators last seen in the last 24 hours.
- Sensor Status — The status of the Host Sensor.
For more information, see Manage TDR Hosts and Host Sensors. - Host/IP — The host name or IP address of the host system.
- Action Requested — The action recommended by Threat Detection and Response for an indicator from a Host Sensor.
- Outcome — Indicates the remediation action taken, if any. No Policy means that there is no policy to take action on this threat.
- User — Indicates which user completed a remediation action. If Threat Detection and Response completes an action, the user is System.
- Action Date — The date and time that the remediation action occurred.
- Previous Score — Shows the previous score assigned to an indicator before a remediation action was completed. This column is not visible by default.
- For Further Investigation — Contains links you can click to search for the MD5 on Google, VirusTotal, and MetaScan.
Not all columns are visible by default. To select which columns are visible, click Choose Columns.
Filter Indicators by Date
To filter the indicators based on the Last Seen date or the Action Date:
- In the column heading, click
 .
.
A date selection dialog box appears. The selected date range filter, if any, appears at the top.
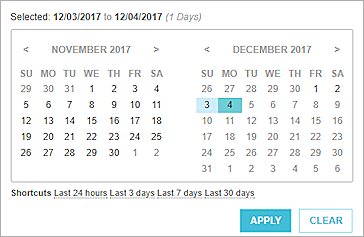
- Select the start and end date on the calendar, or select a date range shortcut. The available shortcuts are:
- Last 24 hours
- Last 3 days
- Last 7 days
- Last 30 days
- To apply the selected date range filter, click Apply.
- To clear the date range filter, click Clear.
Indicator Types
You can apply a filter to the Indicator column to see indicators by the indicator type.
- File — a suspicious or malicious file
- Process — a suspicious or malicious process
- Registry — a suspicious or malicious registry entry on a Windows host
- Host Ransomware Prevention — processes and files with the characteristics of ransomware
- Blocked Sites by Botnet
- Blocked Sites by FQDN
- Blocked Sites by IP
- DNS Question Match
- HTTP APT Blocked
- HTTP APT Detected
- HTTP Bad Reputation
- HTTP Request Categories
- HTTP Virus Found
- SMTP APT Blocked
- SMTP APT Detected
- SMTP Virus Found
You can also see the full log message generated by the Firebox for each network event on the Network Events page. For network indicators, each indicator corresponds to a different event type. For more information, see See Network Events in TDR.
Indicator Scores
ThreatSync analytics assigns each indicator a score based on the severity of the threat. 10 is the highest level threat, and 2 is the lowest. ThreatSync assigns a score of 1 if an indicator was successfully remediated, and a score of 0 if an indicator is on the Whitelist.
For more information about indicator threat scores, see About TDR Threat Scores.
For more information about remediation actions and threat scores, see TDR Remediation Actions and Threat Scores
Actions
Each indicator is associated with a host. Indicators can be related to files or processes on a host, detected by a Host Sensor (![]() ) or network events for traffic to or from a host, or detected by a Firebox (
) or network events for traffic to or from a host, or detected by a Firebox (![]() ) . For indicators reported by a Firebox, remediation actions are completed by the Firebox, based on the settings in the Firebox configuration. For example, APT Blocker, IPS, or Gateway AV could block access to a file, or WebBlocker could block access to a website. For indicators reported by a Host Sensor, the remediation action can be taken automatically by the Host Sensor, based on configured TDR policies, or you can take the requested action to remediate the threat from the Indicators page.
) . For indicators reported by a Firebox, remediation actions are completed by the Firebox, based on the settings in the Firebox configuration. For example, APT Blocker, IPS, or Gateway AV could block access to a file, or WebBlocker could block access to a website. For indicators reported by a Host Sensor, the remediation action can be taken automatically by the Host Sensor, based on configured TDR policies, or you can take the requested action to remediate the threat from the Indicators page.
Action Log and Remediation History
For each indicator, the Action Log shows list of actions for that indicator. For a remediated indicator, the Action Log also includes the Remediation History, which shows the original score of the indicator before it was successfully remediated
To see the Action Log for an indicator
- On the Indicators page, find the indicator.
- In the Outcome column for the indicator, click
 .
.
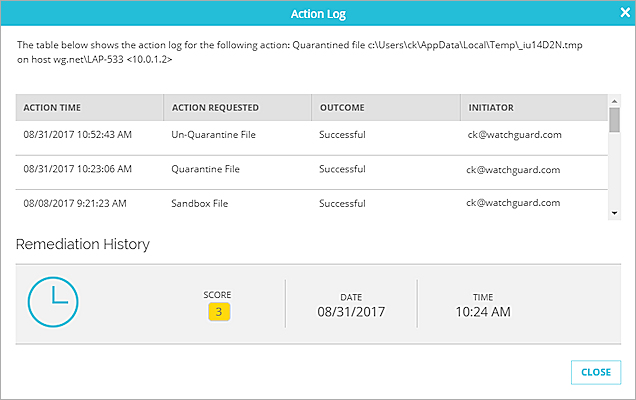
- Click Close to close the Action Log.
Indicator Details
To see more information about an indicator:
- Select ThreatSync > Indicators.
- In the Indicator column, click Additional info.
The Additional Information dialog box appears.
The additional information that appears depends on whether the indicator source was a Host Sensor or a Firebox.
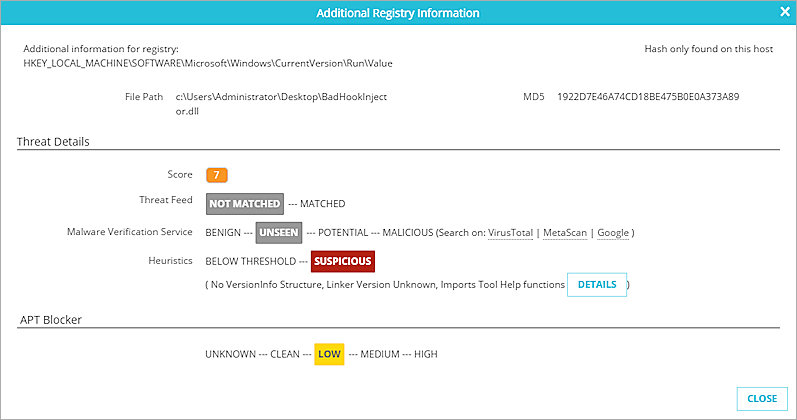
Indicators from a Host Sensor — ![]()
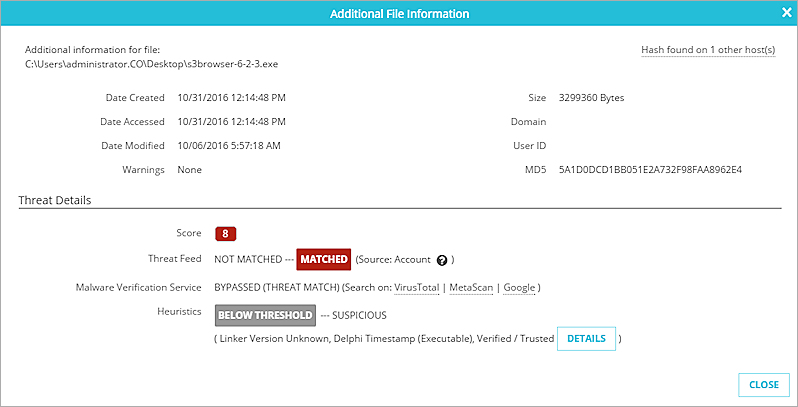
For an indicator reported by a Host Sensor, the Additional Information dialog box shows information about how ThreatSync analytics calculated the indicator score. It shows information about three components of the score: Threat Feed, Malware Verification Service, and Heuristics. The status for each indicator is highlighted.
Threat Feed status options:
- Not Matched — The file or process is not the same as anything in the Threat Feed
- Matched — The file or process is the same as something in the Threat Feed
Malware Verification Service (MVS) status options:
- Benign — MVS identified that the file or process is known to not be a threat
- Unseen — MVS does not have information about the file or process
- Potential — MVS identified that the file or process is a known potential threat
- Malicious — MVS identified that the file or process is a known threat
Heuristics status options:
- Below Threshold — The observed behavior of this file or process is not known to be suspicious
- Suspicious — The observed behavior of this file or process is suspicious.
To see more information about the suspicious event, click Details.
If the hash for this indicator was found on other hosts, the top-right corner of the Additional Information dialog box shows the number of other host sensors that identified this indicator. To see a list of all hosts that identify this indicator, click Hash found on other host(s).
If the Host Sensor requests the Sandbox File action, the Additional Information dialog box also includes information about the status of Sandbox Analysis by APT Blocker.
For more information, see TDR Sandbox Analysis by APT Blocker.
Indicators from a Firebox — ![]()
For an indicator reported by a Firebox, the Additional Information dialog box shows information about the threat reported by the Firebox.
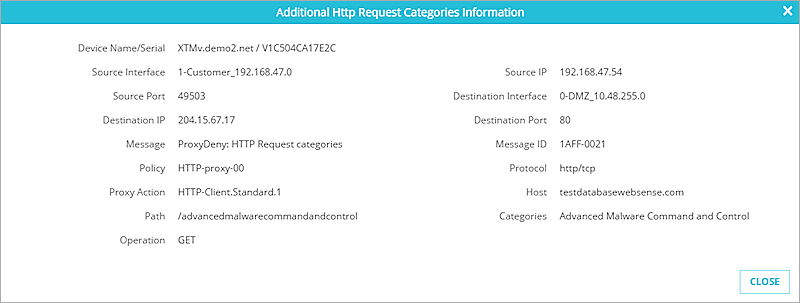
You can see more details about network events identified by a Firebox on the Network Events page. For more information, see See Network Events in TDR.
Further Investigation
To further investigate an indicator, you can look up the MD5 value of the indicator on Google, VirusTotal, or MetaScan.
To look up the MD5 value for an indicator, in the For Further Investigation column click one of these links:
- Search MD5 on Google
- Search MD5 on VirusTotal
- Search MD5 on MetaScan
Create and Export Indicator Charts
You can see the indicators as a bar chart, pie chart, or stacked time series chart. You can export the chart to a .PNG, .JPB, .GIF, or .PDF file.
To create a chart:
- Click the type of chart to generate:
 — Bar Chart
 — Pie Chart
 — Stacked Bar Chart
The selected chart appears
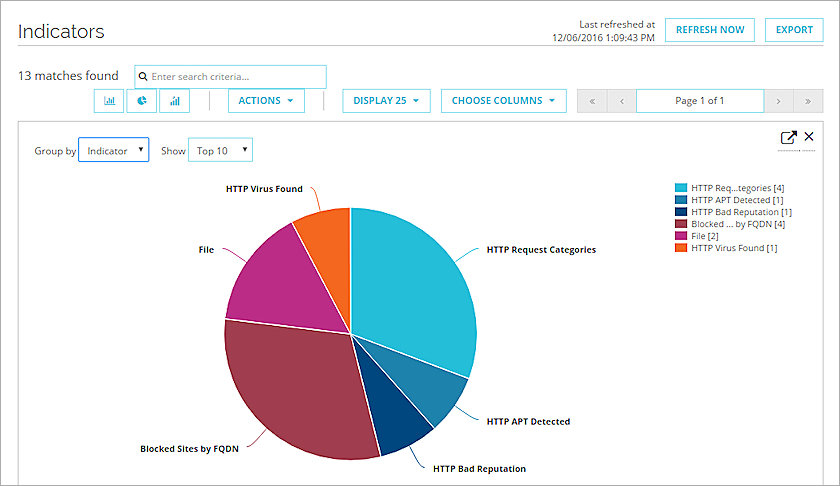
- To change the date range shown in the chart, select a date range at the top.
- From the Group By drop-down list, select how to group the data in the chart.
- From the Show drop-down list, select how many indicators to show in the chart.
- To export the chart, click
 and select the export file format: .PNG, .JPG, .GIF, or .PDF.
The file is downloaded in the selected format.
Execute a Manual Action
You can manually select actions to remediate indicators. The Action Requested column shows the recommended action to remediate an indicator reported by a Host Sensor. When you take the requested action, this is categorized as a Manual remediation in the Remediations widget on the TDR Dashboard page.
The Actions drop-down list tells you how many of the selected indicators each action can apply to. You can select one of these actions:
Mark as externally remediated
Select this action if you have remediated the threat on the system itself. For example, if you have manually removed the file or ended the process specified in the indicator.
Whitelist
Select this action to add this indicator to the Whitelist as a known safe file or process. When you select this action, a whitelist signature override is created with the MD5 of the indicator. For more information about the Whitelist, see Configure TDR Signature Overrides.
Kill process
Select this action to make the Host Sensor end the process specified in the indicator. This action applies to URL Match, Process, or Host Ransomware Prevention indicators. After the Host Sensor identifies the communication port, the Host Sensor ends the process that supports communication to the network port.
Quarantine file
Select this action to make the Host Sensor quarantine the file specified in the indicator. This action uses XOR to encrypt the content of a file so the file is not executable. The quarantined file remains on the host for the number of days specified in the Age Off For Quarantined Files setting. For more information, see Configure the Age Off For Quarantined Files.
If the Host Sensor quarantines a file, and you later decide the file is not a threat, you can go to the Incidents page to remove the file from quarantine. For more information, see Remove a File from Quarantine.
Delete registry value
Select this action to make the Host Sensor delete the registry value for the file or process specified in the indicator. This action deletes the registry value that references a malicious file.
Sandbox file
Select this action to make the Host Sensor upload the suspicious file to the sandbox for analysis. For more information, see TDR Sandbox Analysis by APT Blocker.
The Kill Process, Quarantine File, Delete Registry Value, and Sandbox File actions are the same actions you can configure in a policy. When you select these actions on the Indicators or Incidents pages, these actions are categorized as manual actions.
For indicators with a successfully completed Quarantine File action, you can also select an action to remove the file from quarantine. For more information, see Remove a File from Quarantine.
To execute a manual action:
- Select the check box for one or more indicators.
- From the Actions drop-down list, select the action to complete.
A confirmation dialog box appears, with a list of the indicators the selected action applies to.
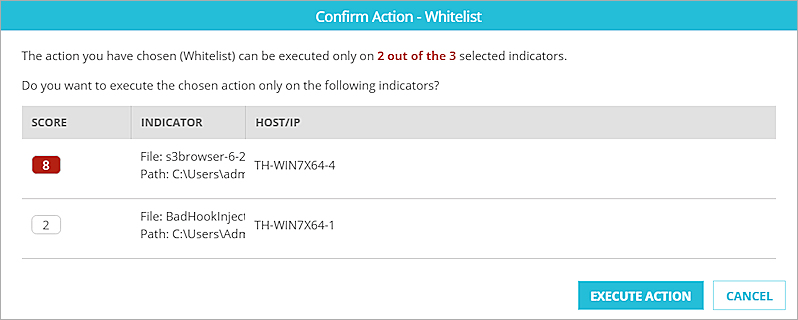
- Click Execute Action.
After the Host Sensor successfully executes a remediation action, the score of the indicator is lowered to 1, and the Outcome column on the Indicators page shows that the action was successful.